

In today’s healthcare environment, problems in the hospital revenue cycle often cause more financial loss than clinical operations. Revenue is not lost in operation theatres — it is lost in reporting gaps, delayed claims, and inefficient financial processes.
For hospital owners, CFOs, and RCM managers in India, tracking the right metrics in hospital revenue cycle management is the difference between financial stability and cash flow stress.
Many hospitals generate strong patient volumes but still struggle with:
Rising claim denials
Delayed TPA payments
Increasing AR days
Revenue leakage
Poor forecasting
The problem is not always effort — it is lack of visibility into the hospital revenue cycle.
This guide explains the most critical revenue cycle metrics every hospital must track, benchmark standards for Indian hospitals, and how these KPIs directly impact profitability.
Hospital revenue cycle management is a multi-stage process:
If performance is not measured at each stage, inefficiencies multiply silently.
Data-driven RCM enables:
✔ Faster collections
✔ Lower denial rates
✔ Improved cash flow
✔ Better insurer negotiation
✔ Accurate financial forecasting
Without KPIs, revenue cycle management becomes reactive instead of strategic.
Front-end errors create downstream denials.
What it measures:
Percentage of patients whose insurance details are correctly verified at registration.
Why it matters:
Incorrect policy verification leads to immediate claim rejection.
Benchmark: > 98%
What it measures:
Average time taken to receive approval from TPA/insurer.
Why it matters:
Delays increase length of stay (LOS) and patient dissatisfaction.
Benchmark:
What it measures:
Amount collected upfront for co-pay, deductibles, and self-pay.
Why it matters:
Improves immediate cash flow.
Benchmark: > 90% of expected patient responsibility
These are the core indicators of hospital revenue cycle management efficiency.
Definition:
Percentage of claims approved without rejection or correction.
Formula:
Clean Claims ÷ Total Claims Submitted × 100
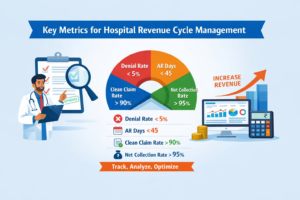
Benchmark in India: > 90%
Low clean claim rates indicate documentation or coding problems.
Definition:
Percentage of claims denied by insurers or TPAs.
Formula:
Denied Claims ÷ Total Claims Submitted × 100
Ideal Benchmark: < 5%
Risk Zone: > 8%
Even a 3–4% reduction significantly increases hospital profits
Definition:
Percentage of claims paid on first submission.
Benchmark: > 85%
High FPRR means strong documentation and coding accuracy.
Definition:
Percentage of receivables outstanding for more than 90 days.
Benchmark: < 15%
Higher aging indicates poor follow-up or denial backlog.\
Definition:
Amount collected compared to the amount contractually allowed.
Formula:
Payments Received ÷ Adjusted Charges × 100
Ideal Benchmark: > 95%
Low NCR indicates underpayments or missed appeals.
Total collections before adjustments.
Useful for tracking overall billing performance.
How much of billed revenue is actually realized.
Benchmark: > 92–95%
Lost revenue due to:
Acceptable Range: < 2%
Even 3% leakage can cost crores annually in mid-sized hospitals
Denial management is critical in hospital revenue cycle management.
Percentage of denied claims successfully recovered.
Benchmark: > 60%
Time taken to re-submit corrected claims.
Benchmark: < 7–10 days
Hospitals must monitor:
Trend analysis reduces repeat mistakes.
| Metric | Ideal Benchmark | Risk Indicator |
|---|---|---|
| Clean Claim Rate | > 90% | < 85% |
| Denial Rate | < 5% | > 8% |
| AR Days | < 45 | > 60 |
| Net Collection Rate | > 95% | < 90% |
| 90+ AR | < 15% | > 25% |
| Denial Recovery Rate | > 60% | < 40% |
| Revenue Leakage | < 2% | > 3% |
This table should be reviewed monthly by CFOs and RCM heads.
Let’s consider an example:
Hospital monthly billing: ₹5 crore
Current denial rate: 9%
AR days: 70
If optimized to:
Impact:
Tracking the right hospital revenue cycle management metrics directly increases profitability.
Advanced revenue cycle systems provide:
CFOs should review dashboards weekly, not quarterly.
Revenue losses often occur because hospitals overlook key operational issues in the hospital revenue cycle.
Some of the most common mistakes include:
❌ Denial trends are often ignored while focusing only on total revenue.
❌ Aging reports are not analyzed regularly to track collection delays.
❌ Insurer-specific reporting systems are missing in many hospitals.
❌ Clear KPI ownership is rarely assigned to revenue cycle teams.
❌ Denial handling is reactive instead of structured and preventive.
To protect profitability, hospitals must link revenue cycle metrics with clear accountability and performance monitoring.
| Frequency | Metrics |
|---|---|
| Daily | Pre-auth TAT, Claim submission |
| Weekly | Denial trends, AR follow-ups |
| Monthly | AR days, NCR, Clean claim rate |
| Quarterly | Revenue leakage audit |
Structured review cycles strengthen hospital revenue cycle management systems.
Strong leadership plays a critical role in optimizing the hospital revenue cycle.
For CFOs and hospital owners, several priorities should guide revenue cycle oversight:
✔ Real-time KPI dashboards should be implemented to monitor performance.
✔ Clear benchmark targets must be defined for revenue cycle efficiency.
✔ Insurer-wise performance reports need regular leadership review.
✔ Quarterly RCM audits help identify operational and financial gaps.
✔ Performance-linked incentives encourage staff accountability.
Revenue cycle management must always be treated as a strategic financial function, not just a back-office task.
Hospitals should consider outsourcing if:
Professional RCM partners bring structured KPI tracking and analytics.
The future includes:
Hospitals that adopt KPI-driven strategies will lead financially.
In today’s evolving healthcare ecosystem, hospital revenue cycle management is no longer a back-office function — it is a strategic growth driver. Patient volumes alone do not guarantee profitability. What truly protects margins is disciplined tracking of revenue cycle metrics like denial rate, AR days, clean claim rate, and net collection rate.
Even small improvements in these KPIs can unlock significant cash flow, reduce revenue leakage, and strengthen financial forecasting. Hospitals that adopt KPI-driven hospital revenue cycle management move from reactive firefighting to predictable, scalable growth.
The difference between financial stress and stability lies in visibility, accountability, and data-backed decisions.
Ready to optimize your hospital revenue cycle management?
Start auditing your KPIs today — or partner with experts who can help you reduce denials, accelerate collections, and maximize revenue realization.
Because revenue isn’t lost in treatment — it’s lost in unmanaged metrics.